Docs
Get started
Opsify documentation
Use this guide to connect your first cluster, understand how credits and models work, and get the most out of the dashboard.
Quick start
Create an account, open the download page for your platform, and sign in to connect a cluster using your kubeconfig.
What you can do with Opsify
Describe what you need in natural language. Opsify reads live cluster state through its tools, explains what it finds, and suggests commands and YAML you execute or apply yourself.
- Query pods, deployments, services, namespaces, nodes, RBAC, storage, CRDs, and more—filter and list across namespaces without memorizing kubectl flags.
- Break big tasks into a visible plan with a todo list that updates as the agent completes steps.
- Generate shell and kubectl commands, run them in the in-app terminal, and feed output back so the next command stays in context.
- Debug with container logs, Kubernetes events, Prometheus metrics (including custom queries), and deployment ReplicaSet history for rollouts and rollback context.
- Read full resource YAML, grep a string across many manifests at once, and use the built-in editor to draft or change configs—with apply only when you choose.
- Pull in outside context with web search and URL fetch when the answer depends on docs, release notes, or a page you specify.
- Track credits, plan status, and usage from the website dashboard.
Agentic tools
Opsify comes with 12+ specialized tools that the AI can use autonomously. Every tool is also available to you directly.
Planning & Automation
Let AI plan and execute complex operations step by step
Plan Tool
Multi-step task orchestrationFor complex tasks, AI creates a structured plan with a todo list and marks items complete as they are done.
Generate Command
One-click executionAI generates shell commands for any task. Click run to execute in your terminal and feed output back for continuous assistance.
Observability & Debugging
Deep visibility into your cluster state and history
Get Logs
AI-powered log analysisRead container logs from any pod. AI analyzes errors, patterns, and helps you understand what went wrong.
Get Events
Real-time event streamFetch Kubernetes events for any resource. See scheduling issues, restarts, and warnings at a glance.
Get Metrics
Prometheus integrationPull metrics directly from Prometheus. CPU, memory, custom metrics—all queryable through natural language.
Get Deployment History
Rollback intelligenceCheck ReplicaSet history to see previous deployments, rollback points, and what changed over time.
Resource Management
Search, inspect, and modify Kubernetes resources
Filter K8s Resources
Cross-namespace searchSearch and filter through pods, deployments, services, and more. Find resources across namespaces instantly.
Read YAML
Config explanationRead the full YAML spec of any Kubernetes resource. AI explains configurations and spots issues.
Grep Tool
Bulk YAML searchSearch for keywords across YAMLs of multiple resources. Find where a config value is used or locate deprecated settings.
Code Editor
One-click applyAI opens a code editor to write YAML or scripts. Click save to automatically apply changes to your cluster.
Web Intelligence
Bring external knowledge into your debugging workflow
Web Search
Up-to-date contextSearch the internet for documentation, Stack Overflow answers, and best practices—all from within Opsify.
Web Fetch
URL content extractionFetch content from any URL. Pull documentation, API specs, or reference material directly into your conversation.
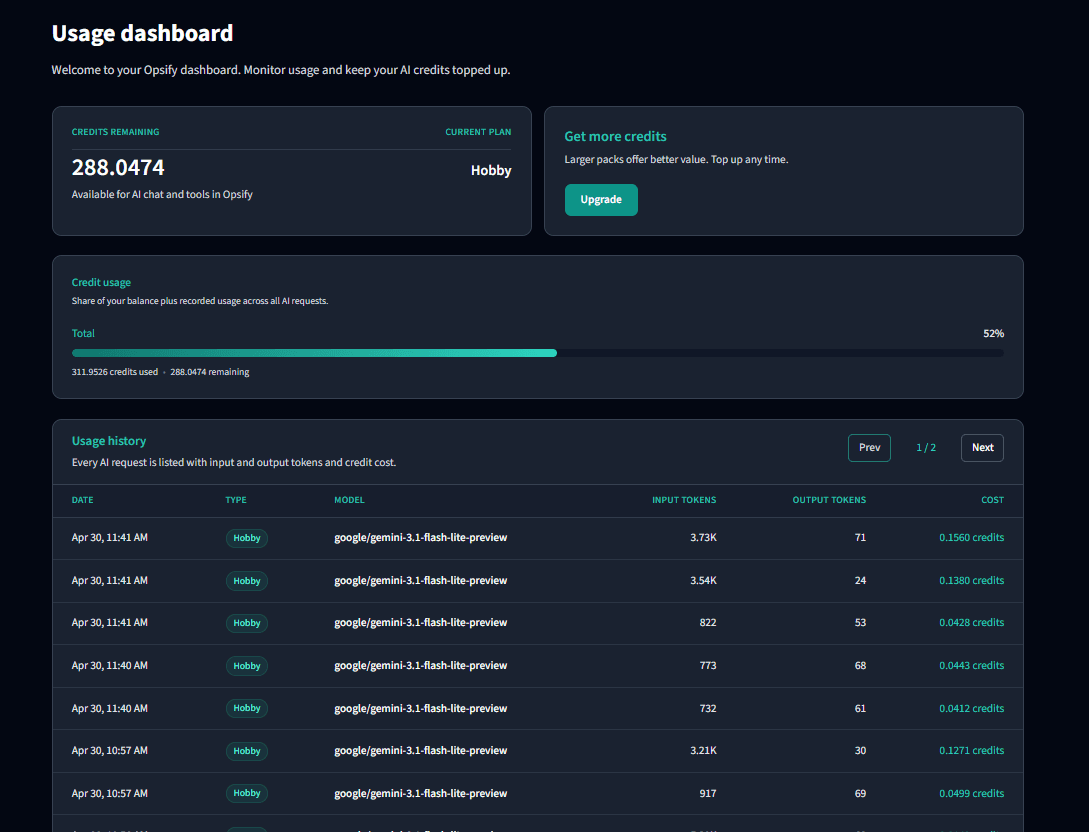
Dashboard & usage
The website dashboard summarizes credit usage, plan status, and recent activity so finance and platform leads get a shared view.
Detailed AI usage appears in the dashboard with input/output tokens, model, and credit cost for each request.
Plans & credits
Paid capabilities are purchased with credits. See the Pricing page for packs and checkout; invoices and tax treatment follow the options shown at purchase time.
Credit balances and consumption are shown in the dashboard and may update shortly after each session.